Showing posts with label Home Sales. Show all posts

Friday, November 11, 2016

Real Estate Roundup: Rising Home Sales and Prices Projected for 2017


Here’s a look at recent news of interest to homebuyers, home sellers, and the home-curious.
2017 FORECAST: STEADY RISE IN HOME SALES, PRICES goingup
Next year will see steady growth in existing-home sales and prices, with stronger growth in 2018, according to the latest forecast by real estate analysts — boosted by a greater number of millennials entering their prime homebuying years, rising household formation, and continued job growth.
Forecasts for the coming year were a highlight of the National Association of Realtors’ annual Conference & Expo, held last week in Orlando, Florida. NAR analysts expect sales to grow  by 2 percent to 5.46 million in 2017, followed by 4 percent growth in 2018. The national median existing-home price is expected to rise by 4 percent next year.
NAR Chief Economist Lawrence Yun said that tight supply and affordability problems currently facing buyers in many markets will gradually ease next year.
“NAR surveys from both current renters and recent buyers prove that there’s an overwhelmingly strong desire among the younger generation to own a home of their own,” Yun said in a statement. “The housing market over the next couple of years should get a big lift in demand from these new buyers. The one caveat is it’s essential that there’s enough new and existing supply at entry-level prices for them to reach the market.”

SAN JOSE, SAN FRANCISCO SELLERS LEAD U.S. IN HOME PRICE GAINS 
U.S. homes sold for an average of 23 percent above their purchase prices in the third quarter of 2016, the highest gain in nine years. And the news is even better in the Bay Area, where homes in the San Jose area sold for 68 percent above their purchase prices and 67 percent in the San Francisco area.
San Jose and San Francisco once again led the nation in home price gains, according to data compiled by ATTOM Data Solutions. They were followed by Portland, Oregon and Seattle (tied at 51 percent) and Los Angeles (49 percent).
The company’s Q3 Home Sales Report also showed that distressed sales nationwide fell to a nine-year low of 12.9 percent of all sales. All-cash purchases also fell to a nine-year low, to 25.9 percent of all sales, down from a peak of 44.8 in 2011.

MILLENNIAL HOMEBUYERS TURN TO REFINANCING
Millennial homebuyers are growing in number, and they’re increasingly choosing to refinance their homes, too. That’s the news from mortgage software provider Ellie Mae, which released its monthly Millennial Tracker report last week.
Refinances accounted for 20 percent of all closed loans by millennial borrowers in September, up from 17 percent in August, the company said. Eighty percent of millennial loans were for home purchases, compared with 54 percent overall for U.S. borrowers.
Other findings from the September Millennial Tracker report:
  • The average FICO score for millennial borrowers rose to 726 in September.
  • The average interest rate on home loans continued declining, to 3.728 percent.
  • The average loan amount increased to $184,179, up from an average of $181,326 in August.
“As the average rate on home loans continues to decline, we are seeing millennials with more purchase power, indicated by the average loan amount increase,” Joe Tyrrell, executive vice president of corporate strategy at Ellie Mae said. “We’re also seeing a slight uptick in the number of refinances in September, indicating maturity among those millennials who previously purchased a home and are looking for an opportunity to lower the cost on their existing mortgage.”
Article and images sourced from http://blog.pacificunion.com/real-estate-roundup-rising-home-sales-prices-in-2017/

Thursday, July 30, 2015

Pacific Union Q2 2015 Newsletter


San Francisco: Q2 Results
San Francisco’s red-hot real estate market continued to sizzle during the second quarter of 2015. It was a fantastic market for sellers: Available single-family homes and condominiums were in short supply at all price ranges, and a substantial majority of properties for sale received multiple offers. The result? Most sales prices topped asking prices, in some cases by wide margins. Typical of this was a San Francisco home offered at $850,000 that sold for $1.15 million.

Although San Francisco remains a challenging market for buyers, there still were deals to be found – particularly with the help of a savvy real estate professional. But buyers had to move fast, as it wasn't uncommon to see attractive, fairly priced properties go under contract just days after appearing on the market. Sellers, meanwhile, faced a dilemma: Putting their homes on the market instantly placed them in the same position as buyers – scrambling to find their next home. The solution for many sellers was to negotiate a rent-back agreement with the buyer, giving them extra time to search for a new home.

Looking Forward: Sales typically ease up during the summer, but don’t mistake a less-frenetic pace for a sea change in the market. With a booming local economy and interest rates still near record lows, there will be no shortage of San Francisco buyers for the foreseeable future.
Median Sales Price
The median sales price represents the midpoint in the range of all prices paid. It indicates that half the prices paid were higher than this number, and half were lower. It is not the same measure as “average” sales price.
Single-Family Homes – Median Sales Price
Click to view larger chart
Condominiums – Median Sales Price
Click to view larger chart
Months’ Supply of Inventory
The months’ supply of inventory is a measure of how quickly the current supply of homes would be sold at the current sales rate, assuming no more homes came on the market. In general, an MSI below 4 is considered a seller’s market; between 4 and 6 is a balanced market; and above 6 is a buyer’s market.
Single-Family Homes – Months’ Supply of Inventory
Click to view larger chart
Condominiums – Months’ Supply of Inventory
Click to view larger chart
Average Days on the Market
Average days on the market is a measure that indicates the pace of sales activity. It tracks, on average, the number of days a listing is active until it reaches “pending” status, meaning all contingencies have been removed and both parties are just waiting to close.
Single-Family Homes – Average Days on the Market
Click to view larger chart
Condominiums – Average Days on the Market
Click to view larger chart
Percentage of Properties Under Contract
Percentage of properties under contract is a forward-looking indicator of sales activity. It tracks expected home sales before the paperwork is completed and the sale actually closes.
Single-Family Homes – Percentage of Properties Under Contract
Click to view larger chart
Condominiums – Percentage of Properties Under Contract
Click to view larger chart
Sales Price as a Percentage of Original Price
Measuring the sales price as a percentage of the final list price, which may include price reductions from the original list price, determines the success of a seller in receiving the hoped-for sales amount. It also indicates the level of sales activity in a region.
Single-Family Homes – Sales Price as a Percentage of Original Price
Click to view larger chart
Condominiums – Sales Price as a Percentage of Original Price
Click to view larger chart
Delving into San Francisco’s Districts
Click to view larger chart
FEATURE STORY
3 Factors Contributing to Bay Area Home Sales Declines
Demand for San Francisco Bay Area real estate has arguably never been more intense, as highly paid professionals flock to the region to take advantage of an excellent job market. But a look at the number of single-family home sales across the Bay Area for the first half of 2015 shows that, for the most part, units sold have been slowing for the past year.

According to MLS data, single-family home sales dropped in six of Pacific Union's nine Bay Area regions* in the first half of this year compared with the same period last year. When comparing this year's first-half sales with 2013's, the pattern becomes even more consistent, with all regions displaying a decrease in the number of homes sold. The two-year declines were largest in Western Bay Area counties, where many of the nation's most desirable jobs are located. (Complete units-sold numbers can be found in the charts below.)

So what's causing the drop in sales at a time when so many people want to own a home in the Bay Area? Pacific Union CEO Mark A. McLaughlin believes that three major factors are at work.

“A slim supply of homes for sale and an increase in the number of off-market sales are certainly the largest drivers of the decline in units sold as recorded by the MLS,” he says, “but fewer move-up buyers in the market also impacts sales.”

Inventory Shortages

Anyone who follows Bay Area real estate is likely familiar with one of our housing market’s major challenges: fewer homes for sale than people that want to buy them. The situation hasn't improved over the past year, with the months' supply of inventory (MSI) for single-family homes sold being lower in June of this year than it was in June 2014 in all of the Bay Area regions in which Pacific Union operates.

An MSI between 4.0 and 6.0 months is generally considered to indicate a balanced market, with lower numbers favoring sellers and vice versa. In June, the MSI across the Bay Area ranged from 0.7 in the Mid-Peninsula region to 2.8 in Napa County, meaning that all of our markets seem to favor sellers.

In Silicon Valley and the Mid-Peninsula, where home sales have declined by double-digit percentages from the first half of 2013, a lack of inventory is a key factor slowing sales, according to David Barca, vice president of those two Pacific Union regions.

“Certainly, if there was more inventory, there would be more sales,” he says.

An Absence of Move-Up Buyers

A lack of homes for sale means that many move-up buyers are sitting on the sidelines, as they are unsure if they will be able to find a new home once they sell their current property. Barca says that in Silicon Valley, one of the nation's most in-demand housing markets, even buyers with plenty of equity and money are staying put.

Both Pacific Union President Patrick Barber and Marin County Region President Brent Thomson cite reduced activity by move-up buyers as a contributing factor to sales declines on both sides of the Golden Gate Bridge. Barca also notes that first-time buyer activity is particularly low in expensive Silicon Valley – except for the young fortunate professionals that play important roles in local tech and social media companies. Otherwise, young first-time buyers may need to rely on parents or relatives who can assist with the down payment.

Another reason that some move-up buyers might be staying put is the impact of federal and state taxes on the seller. The tax-law changes of 2003 provide for capital-gains exemptions of up to $250,000 for single sellers and $500,000 for those who are married. Price appreciation over the past few years has been significant in the Bay Area, and the associated tax impact may give some move-up buyers enough motivation to stay in their existing home and remodel it.

McLaughlin believes that tightened credit markets could also be hindering move-up buyers, as some would not qualify for as large of a mortgage as they did when they purchased their first homes.

An Abundance of Off-Market Listings

While a multiple listing service (MLS) is still the most common way that real estate professionals market their clients' homes, some clients may decide that the best course of action -- for privacy or confidentiality reasons -- is to keep the property out of the public eye. According to an analysis of sales data prepared by Pacific Union's Menlo Park office, private transactions account for about one-third of sales in some San Mateo County enclaves, another factor contributing to the apparent decline in sales volume.

In the combined communities of Menlo Park, Atherton, Portola Valley, and Woodside, off-market sales represented 21 percent of all transactions in the second quarter of 2014. That number increased to 24 percent in the third quarter and 29 percent in the fourth quarter. Private deals rose again in the first quarter of 2015 to 35 percent before relaxing to 30 percent in the second quarter.

Off-market deals have likely also played a role in the slippage of home sales in San Francisco. In a 2014 report, the San Francisco Association of Realtors estimated that private transactions represented 11 percent of home sales in 2013, and Barber speculates that that number has likely since increased.

Pluses of off-market sales include protecting the seller's privacy and avoiding the work associated with holding open houses. However, it's important to note that SFAR found that homes not listed on the MLS in 2013 sold for an average of 17 percent less than those that were. Whether or not to make their home available to the public is a decision that sellers should carefully consider and discuss with their trusted real estate professional.


* For more information on how Pacific Union defines our individual Bay Area regions, please refer to the charts found in our Q2 2015 quarterly report.

BAY AREA DATA
Review the Latest Bay Area Data & Stats
Bay Area 10-Year Overview
Here’s a look at home sales in the Bay Area’s real estate markets in the second quarter of 2015, with a glance back at the 10 preceding second quarters.
10 Year Chart


Tuesday, May 5, 2015

San Francisco Homes Sales, Median Price Slip


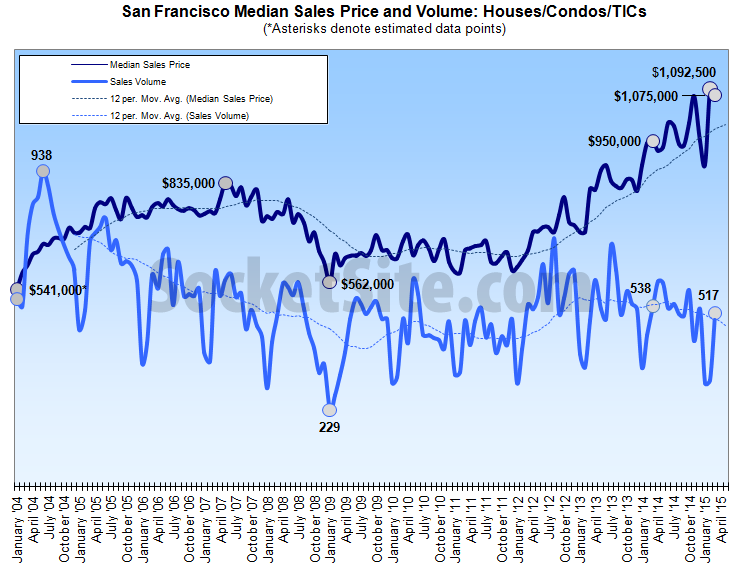
San Francisco Homes Sales and Median Price

With inventory ticking up, recorded home sales activity in San Francisco was 4 percent lower on a year-over-year basis last month but jumped 63 percent versus February, primarily due to normal seasonality and a 30 percent drop in sales the month before.

Sales activity in San Francisco typically increases around 40 percent from February to March.

The median price paid for a home in San Francisco slipped to $1,075,000 in March, down 2 percent from the record high of $1,092,500 in February, but it remains 13.2 percent higher versus the same time last year.

Keep in mind that while movements in the median sale price are a great measure of what’s in demand and selling, they’re not necessarily a great measure of appreciation or changes in value and are susceptible to changes in mix, such as a significantly higher percentage of “luxury” sales.

Article and image sourced from http://www.socketsite.com/archives/2015/04/san-francisco-homes-sales-and-median-price-slip.html

Tuesday, April 21, 2015

Economy Drives Explosive Home Sales Growth in the Bay Area in March

Home sales in the Bay Area shot up by almost 60 percent from February to March while prices increased in all nine counties, thanks in large part to our region’s vigorous economy.Toy houses
The California Association of Realtors’ March home sales and price report says that single-family home sales increased by 56 percent across the Bay Area from February, with six local counties posting monthly gains in excess of 50 percent. Month-over-month sales volume upticks ranged from 90.6 percent in Alameda County to 28.9 percent in Solano County. Across the region, home sales were up 9.9 percent from March 2014.
Statewide, home sales increased 6.3 percent month over month and 7.3 percent from one year ago. According to CAR President Chris Kutzkey, California’s strong economy and job growth are helping fuel demand for real estate.
“The housing market is picking up momentum and continuing its upward trend as economic conditions improved throughout the state,” Kutzkey said in a statement accompanying the report.
In the Bay Area, March’s median sales price rose to $809,200, up 9.3 percent from February and nearly identical to the gain observed statewide. All nine counties reported month-over-month price growth in March, ranging from 10.4 percent in San Francisco County to 1.9 percent in Santa Clara County. Home prices were up year over year in all local counties except for Napa.
As in February, CAR says that Bay Area counties had the five highest median sales prices in California, with San Mateo County in the No. 1 position at $1,300,000. San Francisco was the state’s second most expensive county, at $1,275,000, followed by Marin County ($1,085,230), Santa Clara County ($932,100), and Contra Costa County ($784,950).
According to CAR, the Bay Area is the only metro region in the state where the average buyer paid a premium to secure a home in March – 105.9 percent of original price. The main reason: tight supply conditions, which worsened across the region from February, with the months’ supply of inventory (MSI) dropping to 2.4.
Four Bay Area counties had the lowest MSI in the state, and all but one had a smaller supply than the 3.8 recoded statewide. San Mateo and San Francisco counties tied for slimmest supply at 1.6, followed by Santa Clara County at 1.9 and Alameda at 2.0. Perhaps not surprisingly, three of those counties saw the quickest sales pace in California, with the average home selling in 17.7 days in Santa Clara, 17.9 days in San Mateo, and 20.7 days in San Francisco.